If you are a true hockey fan, you probably enjoy checking out the stats of your favourite player or your favourite NHL team. Ever since I was a young boy, I used to always gather the stats of the Edmonton Oilers and every Tuesday (I think it was) when the Edmonton Journal would publish the NHL statistics for every NHL team I would spend what seemed liked hours studying the numbers and seeing was was the best and who was the worst for a given stat. How many team had players with double digit goals or assists? How many players were on pace for a 100-point season? Which goalie had the most shutouts? I loved it. Today there are analytics firms that specialize in hockey stats, trend analysis and complex graphic models. (Why didn’t I think to start such a firm?)
Every time your turn on a game nowadays, the announcers and intermission panels are often talking about various stats and analytics. It’s all about the data. Which is really great. Some people will argue that stats are just numbers and that it’s the eye test that is the most useful when analyzing performance. I tend to disagree. It’s actually a combination of both. For example, if you look at goaltenders stats and you see that a tender that has played in 40% of their teams’ games and only has two wins, that can tell you something. If you’ve watched the goalie play and noticed that they are off with their positioning and rebound control, that tells you something. The eye test and statistical data work together and allow coaches to make more informed decisions specific to performance.
The other day I hears a few stats that were being quoted from the 2016-17 NHL season and it got me thinking about the past decade and which players have been the most effective? Which teams (other than the obvious ones) had experienced the most success? With that I started poking around to look at some of the statistics from the National Hockey League over the past decade. Here are a few observations.
NHL Team Stats from the Past Decade
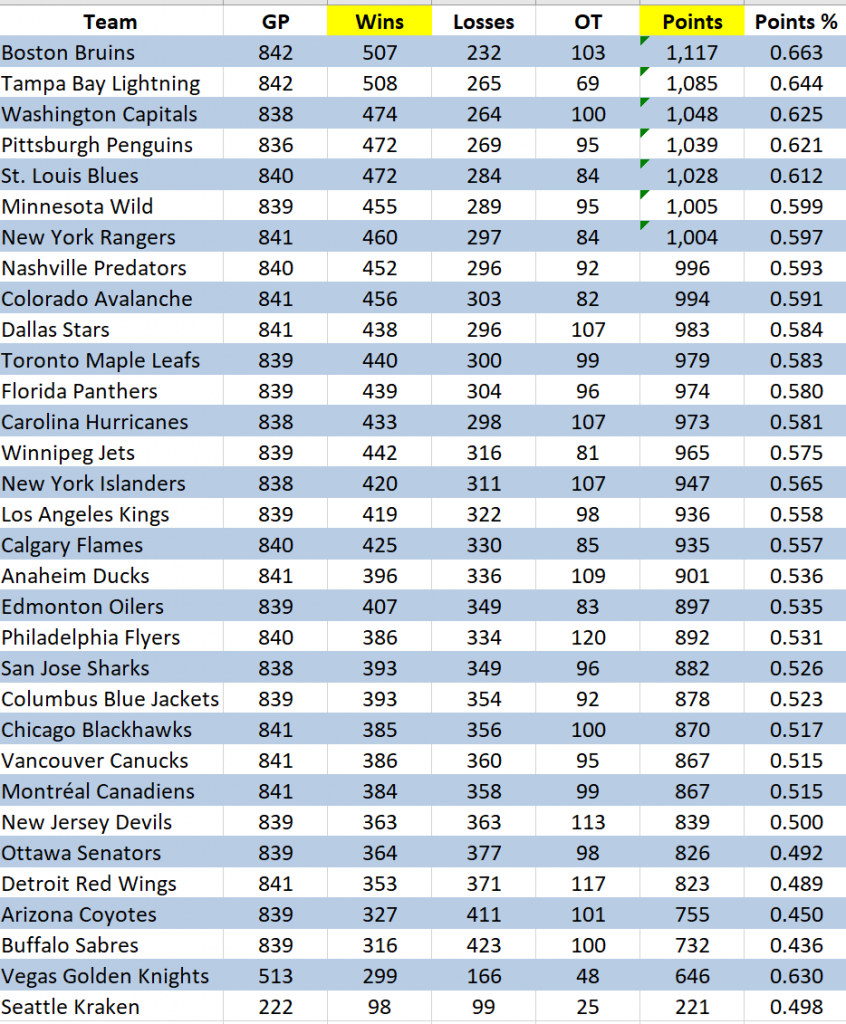
These stats consist of the 2013-14 NHL season through to February 26, 2024 of the 2023-24 NHL Season.

- The Boston Bruins have been the dominant franchise over the past decade with a .663 winning percentage posting 507 wins and another 103 OT wins in the regular season during this time.
- When it comes to futile performance (including the two expansion teams), the Buffalo Sabres have only won 43.6% of their games over the past decade. They have not made the post season during this time.
- Would you believe that the Toronto Maple Leafs have been the top performing Canadian team in the regular season over the past ten years? (Although the Winnipeg Jets have actually two more wins than the Leafs during this time).
- The Philadelphia Flyers (120) and Detroit Red Wings (117) are most likely to get points in OT.
- The Washington Capitals (45), Nashville Predators (44) and Florida Panthers (44) have the most wins in the Shoot-Out over the past ten regular seasons. The team with the least wins in the shootout (excluding expansion Vegas and Seattle)… the New Jersey Devils with 27 wins in the shoot-out.
Top 5 NHL Teams in Scoring over the Past Decade
Ever wondered which teams score the most goals year in and year out? Here is a look at the top five team in terms of goals scored from 2013-14 through 2023-24 (Based on Regular Season statistics):
| Team | # of Goals Scored |
| Tampa Bay Lightning | 2,746 |
| Toronto Maple Leafs | 2,649 |
| Pittsburgh Penguins | 2,627 |
| Boston Bruins | 2,603 |
| Washington Capitals | 2,595 |
The team that has scored the least goals over the past decade (excluding expansion teams)? The Arizona Coyotes with 2,124.
Top 5 NHL Teams in Goals Against over the Past Decade
Here is a look at the top five stingiest teams when it comes to scoring. (Based on Regular Season statistics)
| Team | #of Goals Allowed |
| Boston Bruins | 2,087 |
| Los Angeles Kings | 2,234 |
| Carolina Hurricanes | 2,266 |
| New York Rangers | 2,294 |
| Minnesota Wild | 2,303 |
The Buffalo Sabres have allowed the most goals over the past ten seasons with 2,673. Again, the Sabres have not made the playoffs during this time. Attention to defense and goaltending should be the focus in Buffalo.
Top 5 Teams with the Best Powerplay in the past 10 seasons
Here is a look at the top five NHL teams that have had the most lethal powerplay during the past decade. (Based on Regular Season statistics)
| Team | Power Play Percentage |
| Edmonton Oilers | 23.0% |
| Tampa Bay Lightning | 22.7% |
| Boston Bruins | 22.3% |
| Toronto Maple Leafs | 22.2% |
| Washington Capitals | 21.8% |
The team with the worst powerplay over the past ten years? The Montreal Canadiens with a 17.2% rating.
Top 5 NHL Teams with the best Penalty Kill over the past 10 seasons
Here are the toughest team to score against when on the powerplay. The top five NHL teams with the best penalty kill over the past ten NHL seasons.
| Team | Penalty Kill % |
| Carolina Hurricanes | 83.7% |
| Boston Bruins | 83.4% |
| Pittsburgh Penguins | 81.9% |
| Washington Capitals | 81.9% |
| San Jose Sharks | 81.8% |
NHL Playoff Stats over the Past Decade
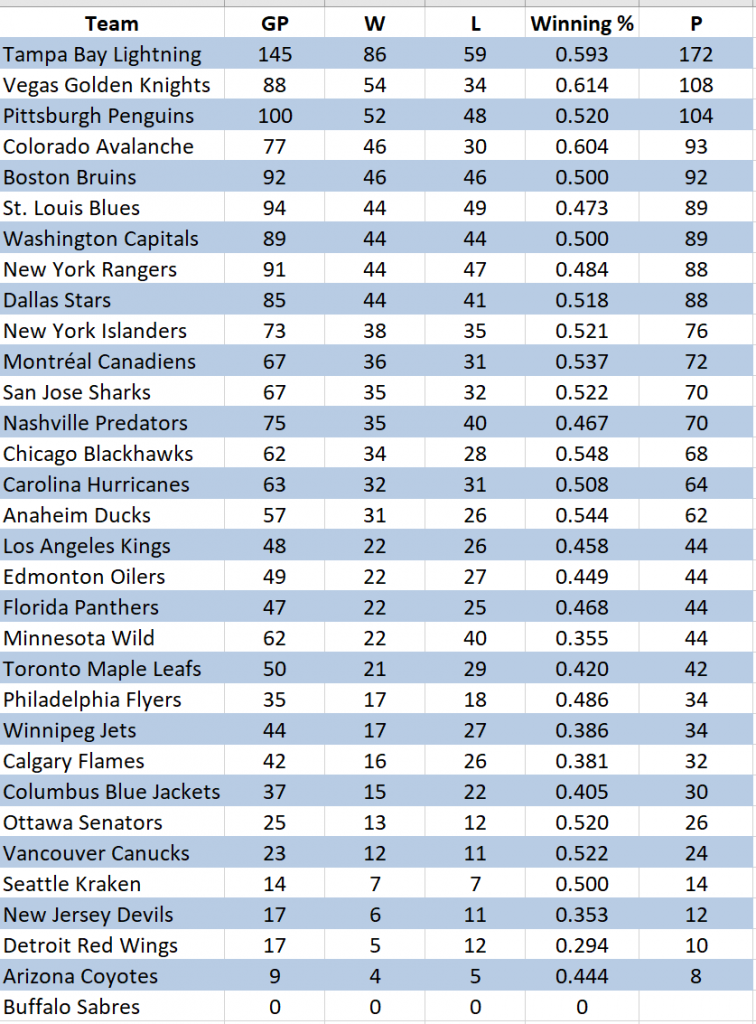
Here is a look at top NHL teams during the post season over the past ten years. Of course the ultimate performance indicator would be Stanley Cup championships, but here’s a look at some of the teams that have had some decent playoff success over the past decade.

Most Playoff Games Played in the past 10 years
Here’s a look at the teams who have had some long playoff runs over the past ten seasons.
| Team | # of playoff games |
| Tampa Bay Lightning | 145 |
| Pittsburgh Penguins | 100 |
| St. Louis Blues | 94 |
| Boston Bruins | 92 |
| New York Rangers | 91 |
Do you ever wonder about how the Western Conference teams have so much more travel during the regular season and the impact on the fatigue of those teams? You have to think that there is an impact come playoff time.
Top NHL Teams based on Post-Season Winning Percentage
Here is a look at the teams with the best winning percentage in the playoffs over the past ten years.
| Team | Winning % | # of Playoff Games Played |
| Vegas Golden Knights | 0.614 | 85 |
| Colorado Avalanche | 0.604 | 77 |
| Tampa Bay Lightning | 0.593 | 145 |
| Chicago Blackhawks | 0.548 | 62 |
| Anaheim Ducks | 0.544 | 57 |
| Montreal Canadiens | 0.537 | 67 |
| San Jose Sharks | 0.522 | 67 |
| Vancouver Canucks | 0.522 | 23 |
| New York Islanders | 0.521 | 73 |
| Pittsburgh Penguins | 0.520 | 100 |
See any noticeable trends in terms of NHL franchises that have won it all during the past ten National Hockey League seasons? In an upcoming post we take a look at the top performing players over the past decade.
Follow us on twitter (X) at @hockeyfanatics.